Caleb Bourgeois
15 years of consulting experience, now focused on enterprise planning
Design consultant with 15 years of experience leading client engagements, guiding discovery, clarifying requirements, and delivering structured solutions to complex business problems. Known for translating unclear ideas into clear direction and building strong working relationships with stakeholders throughout the process.
I bring a rare combination: deep consulting instincts paired with the ability to design dashboards and data visualizations that executives actually want to use. Completed Anaplan Level 1 & 2 Model Building training with hands-on experience in model architecture, DISCO methodology, and planning logic for finance and supply chain use cases.
- Built finance and supply chain planning models using DISCO methodology (Data, Input, System, Calculation, Output), constructing modules, hierarchies, lists, line items, time-based dimensions, and cross-module formulas
- Designed end-user dashboards with KPI grids, charts, and drill-down views; configured role-based access, selective permissions, and model deployment workflows across sprint-based, user-story-driven projects
- Applied 15 years of data visualization and information design expertise to structure executive-ready dashboard layouts that surface key metrics and improve stakeholder decision-making
- Drove end-to-end client engagements, translating complex business requirements into structured communication and digital systems across 7+ concurrent accounts
- Spearheaded cross-functional discovery sessions with stakeholders to define project scope, gather requirements, and align deliverables with business objectives
- Architected information frameworks across campaigns, reports, and digital platforms, converting ambiguous client needs into clear, actionable solutions
- Redesigned internal workflows and approval processes, accelerating project turnaround and improving team throughput
- Executed 30+ client engagements end-to-end from initial discovery through delivery, managing requirements gathering, iterative feedback cycles, and final implementation
- Translated ambiguous stakeholder requirements into structured solutions including websites, brand systems, and data-driven communication frameworks
- Designed KPI-focused reports and data visualizations for clients including enrollment dashboards, funding summaries, and demographic breakdowns that structured complex data into clear, executive-ready formats
- Rebuilt a nonprofit’s web platform into a user-centered system that expanded accessibility and community reach
- Directed all creative strategy and communication systems across branding, web, video, and digital channels for a multi-department organization
- Spearheaded a comprehensive organizational rebrand, establishing unified identity and messaging across all touchpoints
- Implemented a centralized communication platform that consolidated workflows and improved cross-departmental coordination
- Delivered structured campaign and communication solutions by translating client business needs into actionable creative deliverables across print, digital, and environmental design
- Managed full project lifecycles from client scoping through production; expanded agency capabilities by pioneering video and motion offerings
Data visualization & dashboard design
Examples of KPI-focused reports and data visualizations designed for Blue Ridge Community College. These executive-ready layouts mirror the type of dashboard design used in enterprise planning platforms like Anaplan.
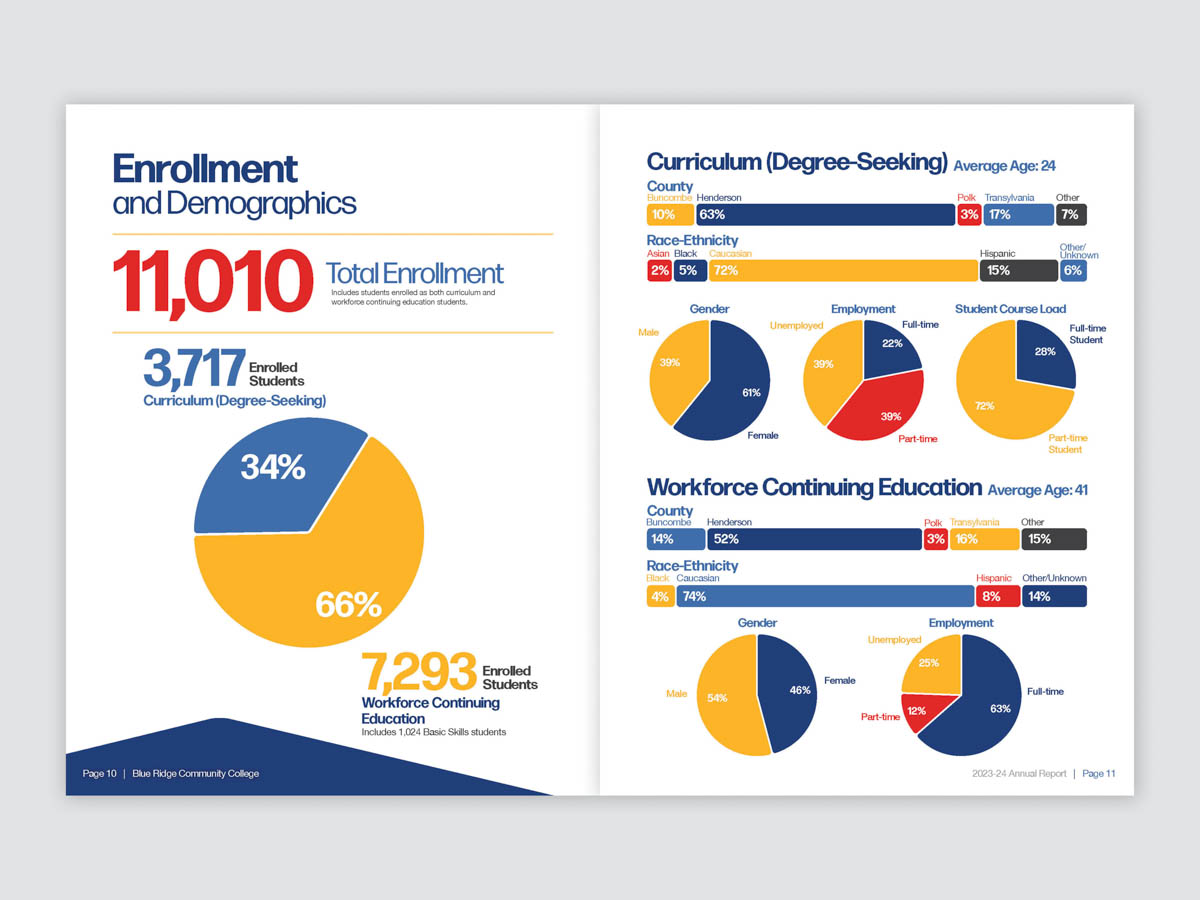
Enrollment & Demographics Dashboard
11,010 total enrollment with KPI breakdowns by program type, county, race-ethnicity, gender, employment status, and course load. Pie charts, stacked bars, and segmented data views designed for executive stakeholder review.
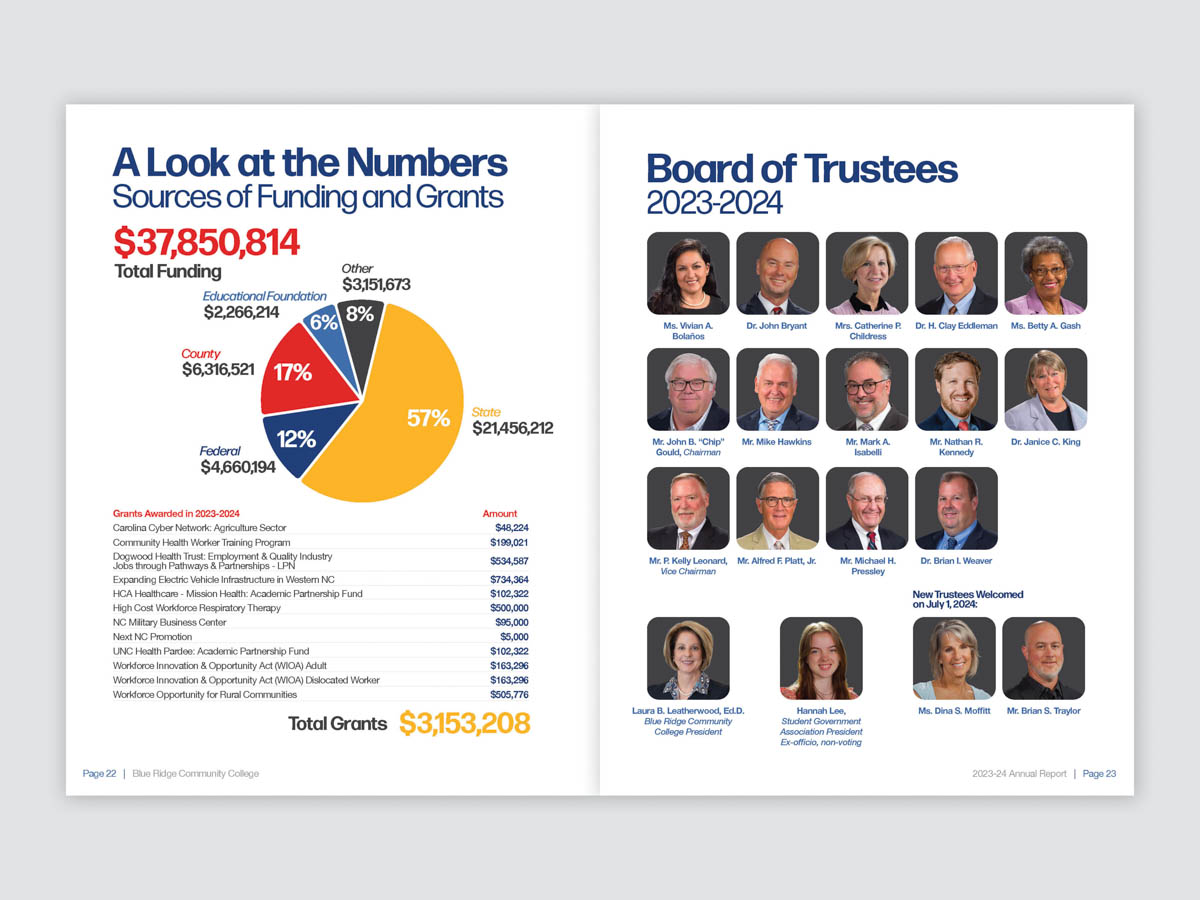
Financial Summary & Funding Sources
$37.8M total funding visualized by source allocation (State 57%, County 17%, Federal 12%, Foundation 6%, Other 8%). Includes detailed grants table with line-item amounts totaling $3.15M.
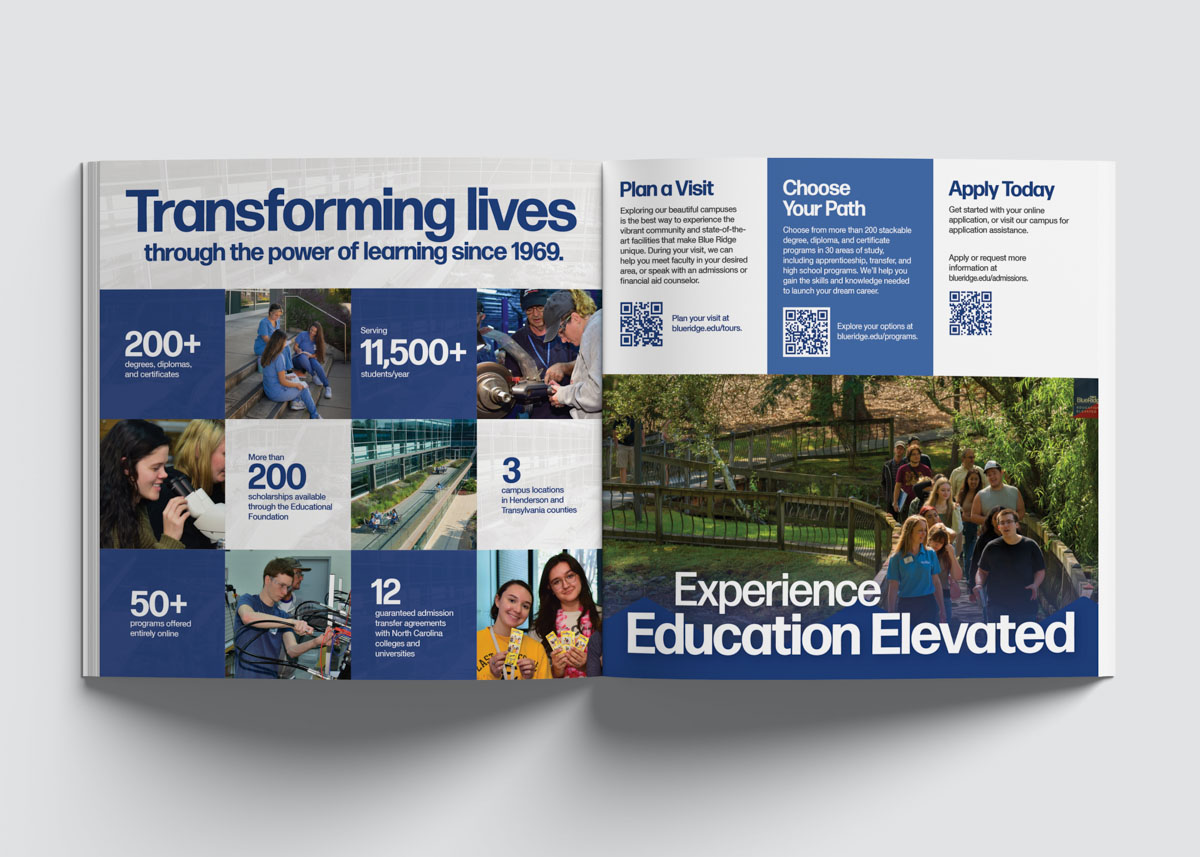
KPI Metrics Overview
Executive-level metrics display: 200+ programs, 11,500+ students/year, 200 scholarships, 3 campus locations, 50+ online programs, 12 transfer agreements. Tile-based layout designed for at-a-glance stakeholder consumption.
Selected studies in strategy, structure, and execution
A few deeper examples of how I approach real client problems: clarifying the need, structuring the work, and delivering something practical, polished and useful.
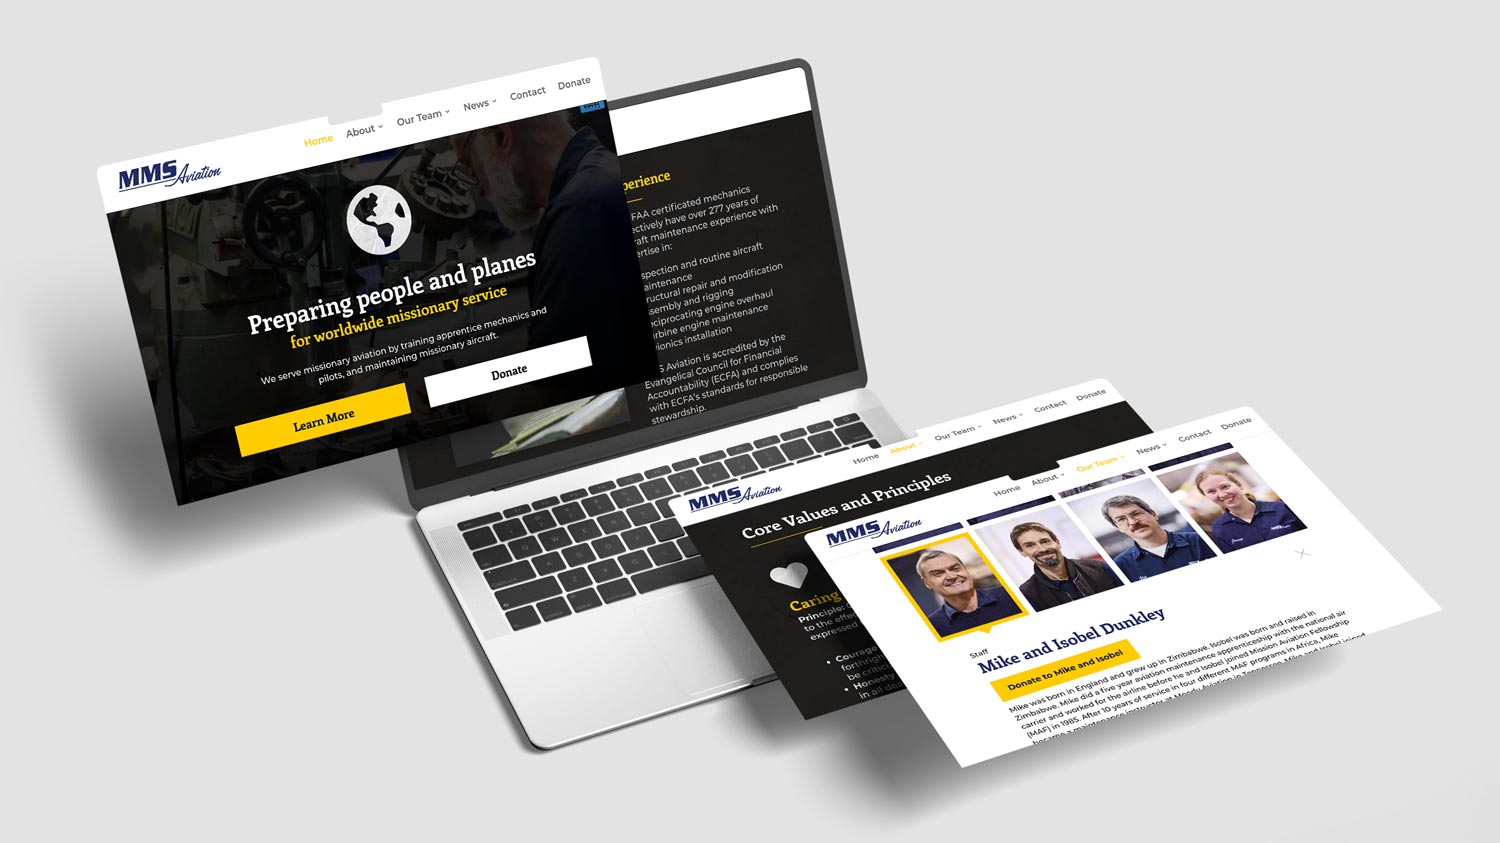
MMS Website Rebuild
A full website rebuild focused on structure, clarity, and usability. The project involved translating a cluttered digital experience into a more organized, credible, and user-friendly platform that better supported the client’s goals.
View Case Study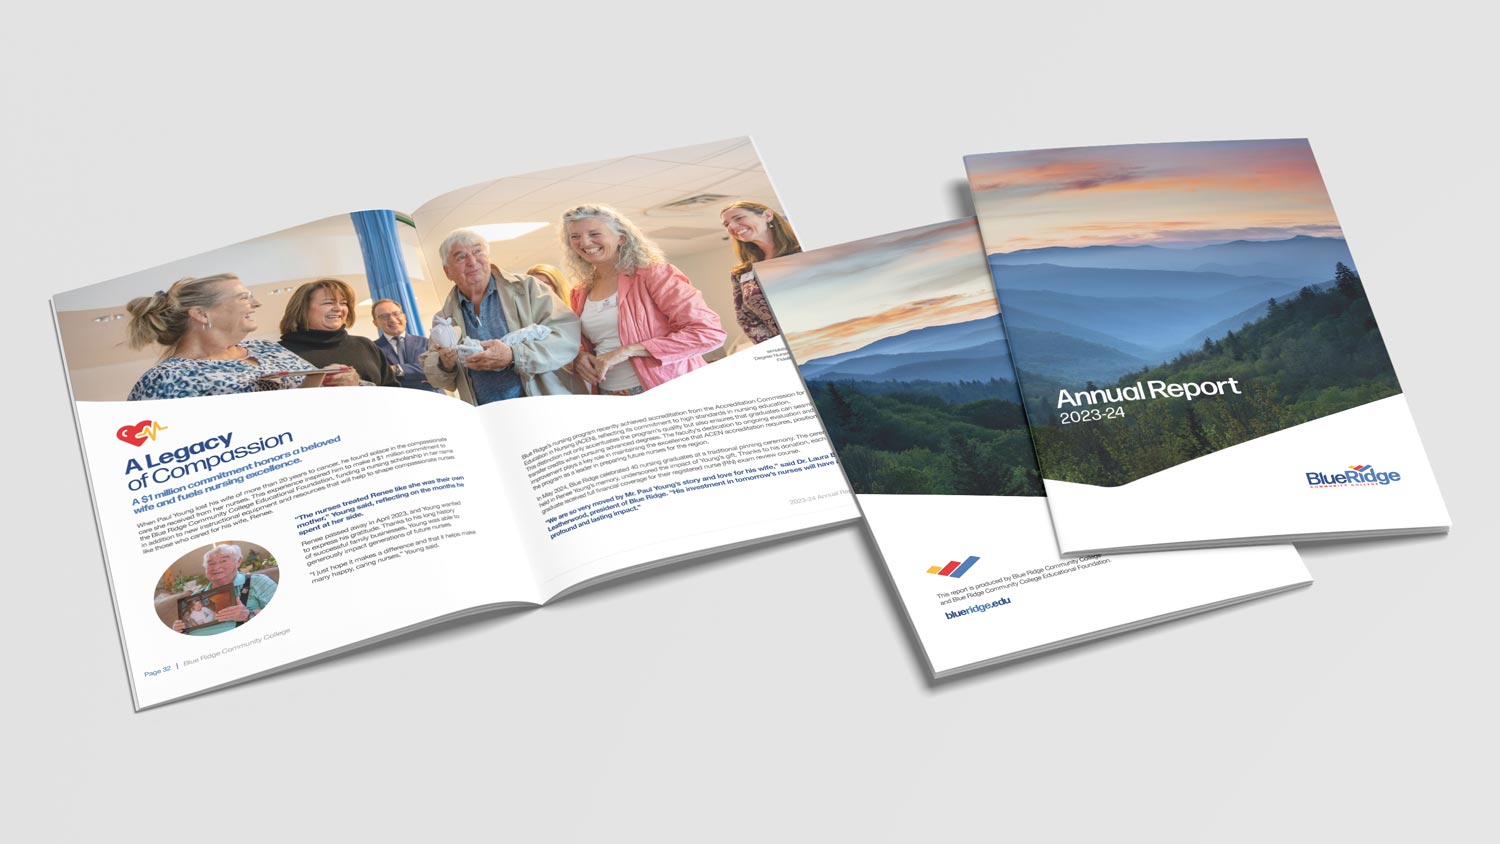
BRCC Annual Report
A data-heavy annual report shaped for readability and executive communication. This work centered on organizing large amounts of institutional information into a clear visual hierarchy that made key metrics and outcomes easier to understand.
View Case Study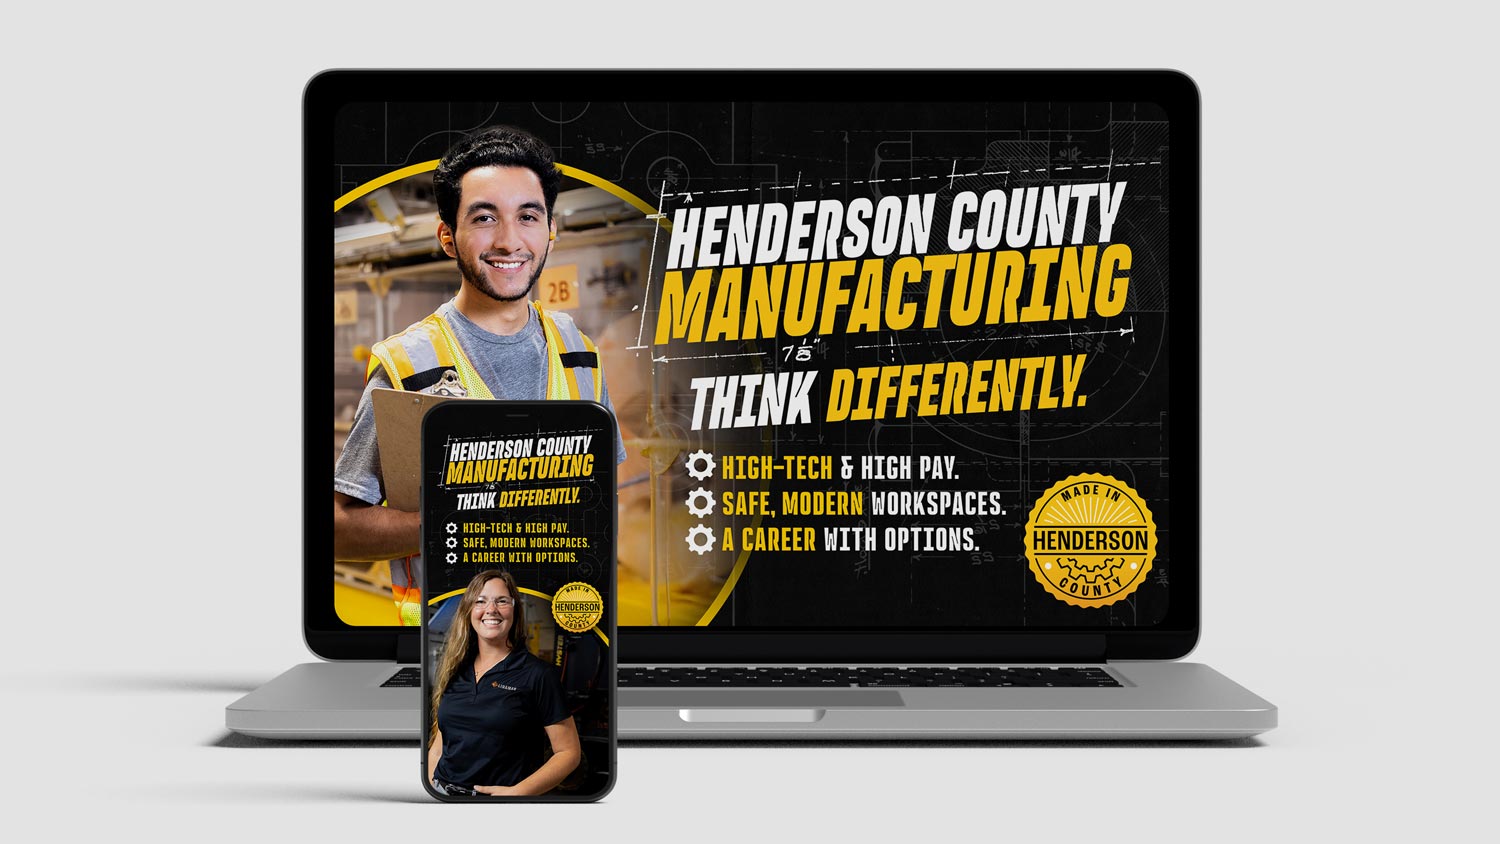
Made in Henderson County
A regional branding and promotion piece built to highlight local industry with clarity and pride. The challenge was balancing storytelling, economic messaging, and visual consistency across a piece meant to inform and represent the community well.
View Case Study